What it does Link to section: What it does
I built Market Atlas as a public market research workspace with React, TypeScript, Recharts, and Cloudflare Workers. One Worker (code running on Cloudflare’s servers) serves the APIs (interfaces for requesting data) and built static assets (the site’s files). The default configuration needs no account, brokerage connection, or paid API key.
Watchlists, portfolio settings, and saved research views stay in the visitor’s browser in localStorage (storage kept by the browser on that device).
Research tools Link to section: Research tools
Market and sector views Link to section: Market and sector views
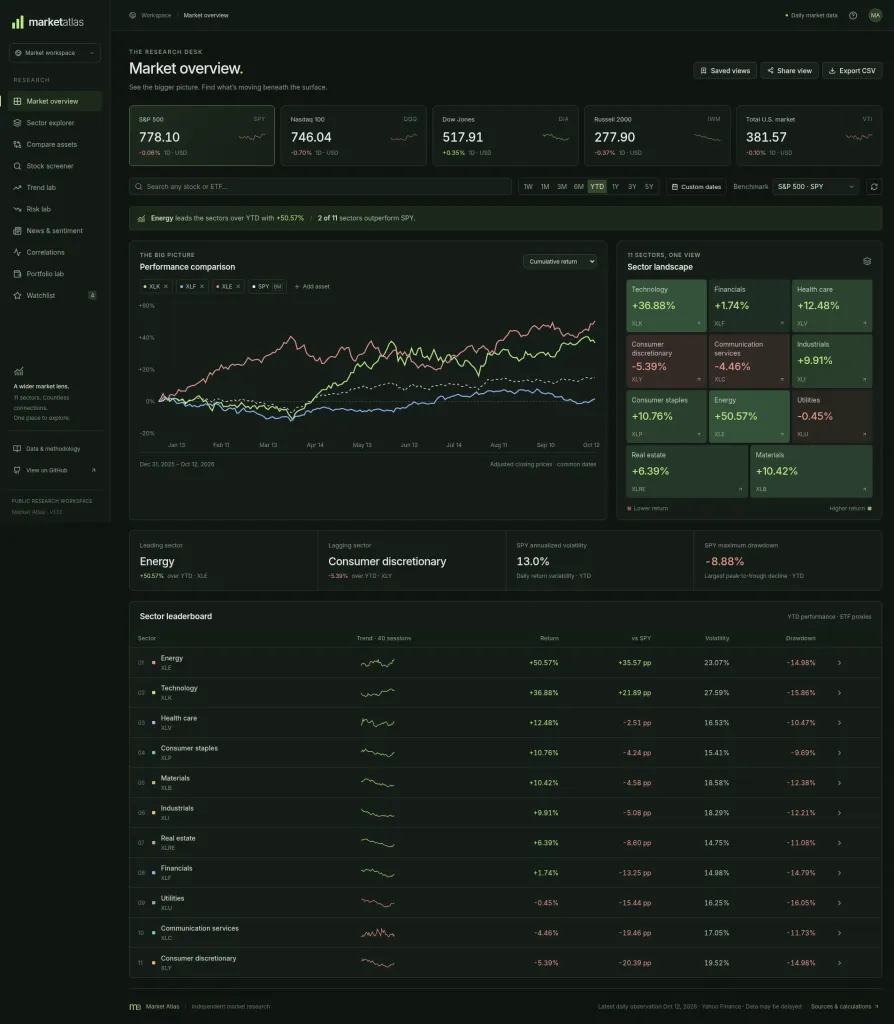
The Market overview brings together:
- Five benchmark (reference asset) ETF (exchange-traded fund) quotes.
- Cumulative return (growth over time), relative return (performance against a benchmark), and drawdown (decline from a previous peak) charts.
- All 11 U.S. sector ETFs and sector leaders.
Sector explorer adds absolute and benchmark-relative heatmaps (color-coded comparisons), return tables, and a relative momentum scatter plot (a comparison of recent performance against a benchmark).
Asset comparisons and screening Link to section: Asset comparisons and screening
Compare assets puts up to 12 stocks, sectors, or global assets alongside a benchmark, with returns, excess returns (returns above the benchmark), drawdowns, and hypothetical growth.
The Stock screener covers 54 selected U.S. large-cap stocks (companies with large market values) with sector and technical filters (filters based on price patterns); symbol search can find supported assets beyond that catalog.
Trends, risk, and correlations Link to section: Trends, risk, and correlations
Trend lab shows rolling returns (returns over a moving time window), volatility (how much returns vary), correlation (how returns move together), beta (sensitivity to benchmark returns), monthly return calendars, and descriptive seasonal averages.
Risk lab compares drawdowns on shared dates and separates completed recoveries from ongoing episodes.
Correlations shows pairwise daily-return matrices (tables comparing each pair of assets) for sectors, global assets, or the selected comparison.
Portfolio simulations Link to section: Portfolio simulations
Portfolio lab runs USD-only (U.S. dollar) simulations with custom starting capital, buy and hold (keeping the initial holdings) or monthly, quarterly, or yearly rebalancing (resetting holdings to the chosen proportions), allocation and profit-contribution breakdowns, and risk measures.
The Watchlist keeps saved tickers (asset symbols) on the device.
Dates, saved views, and exports Link to section: Dates, saved views, and exports
Research windows use preset horizons (time spans) or custom dates. Historical technical indicators (measures based on past prices) stop at the selected end date; quote cards remain current.
Shareable research URLs preserve the selected research settings, and up to 20 named views can be saved locally. Watchlists and portfolio settings remain separate device settings and are not included in shared URLs.
CSV (comma-separated values) exports cover research tables, simulations, watchlists, and news.
News and sentiment Link to section: News and sentiment
Headline search Link to section: Headline search
The RSS/Atom (web feed formats) headline directory lists 132 publishers and institutions, with 55 checked feeds. Headline search supports words, phrases, alternatives, exclusions, and field filters over the retrieved headlines.
How sentiment scores work Link to section: How sentiment scores work
Sentiment uses a transparent English lexicon heuristic (a rule-based score using a list of words). It is not an AI forecast or a trained finance model: scores describe headline word choice, not likely returns. Matched cues, scoring coverage, and sample sizes make the calculation inspectable.
News charts describe the currently retrieved snapshot, not a historical archive. Feed entries are reduced to headline, original URL, publisher, and publication time; no full articles are scraped.
Data and limits Link to section: Data and limits
History and caching Link to section: History and caching
Market data comes from Yahoo Finance’s public unofficial chart and search endpoints (API addresses), with no guaranteed service level. This is a research feed, not an execution-quality real-time feed. It provides up to five years of daily history; successful histories are cached at the Cloudflare edge (servers near visitors) and stay fresh for 15 minutes.
Price adjustments Link to section: Price adjustments
Returns use adjusted closes (closing prices adjusted for events such as stock splits and dividends) when the entire series supports them. Incomplete adjustment falls back to closes for the whole series with a warning. Missing prices are never fabricated or forward-filled (replaced with the last known price).
Coverage and permitted use Link to section: Coverage and permitted use
The screener catalog is curated rather than a complete stock universe. The application provides no structured fundamentals (company financial measures), options data (contracts to buy or sell at a set price), brokerage actions, or intraday streaming (continuous updates during the trading day). The MIT license covers my code, not third-party market data, which remains subject to provider terms.
Market Atlas is for research and education only, not investment advice. Historical results do not guarantee future performance.